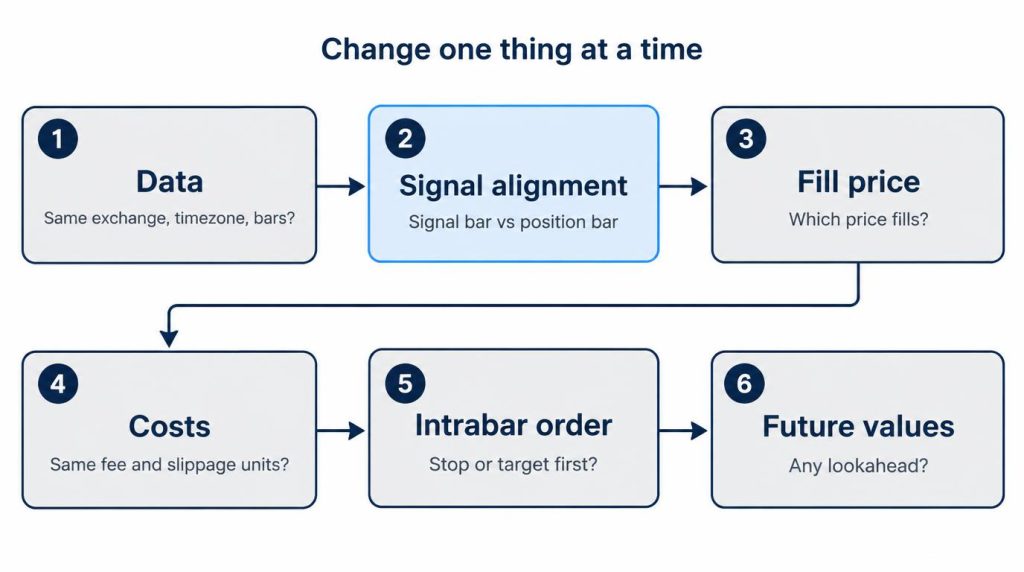
When TradingView and a Python backtest disagree on the same strategy, check six things in order: data, signal alignment, fill price, costs, intrabar order, and lookahead. In my case I suspected the data first, then TradingView’s fills. Neither was the culprit.
My Python code applied each signal to the return of the bar that produced it. One missing shift(1) was the cause.
The setup was a moving-average, long-only strategy, run as a Pine strategy and as my own Python backtest. Signals landed in about the same places, but entry prices and the profit factor (PF) didn’t match.
This is a way to verify a backtest, not investment advice. All results are from backtests on Binance BTCUSDT 15-minute bars (trading window August 20 to October 1, 2026, UTC), run on October 6, 2026.
TradingView’s Strategy Tester is the panel that runs a Pine strategy() script on historical bars through a simulated broker and reports trades, net profit, and PF. The Pine docs now call that output the strategy report.
On this page
- The six checks, in the order I run them
- Does TradingView fill at the close or the next bar’s open?
- Lookahead without any future rows: my missing shift(1)
- How do you match commission and slippage between TradingView and Python?
- Stop-loss and take-profit in the same bar: which fills first?
- Can request.security() leak future data into a backtest?
- Is repainting the same problem as lookahead?
- My step-by-step match: four stages, same numbers
- Is a TradingView backtest accurate enough to rely on?
The six checks, in the order I run them
Comparing the data is a necessary first step. In my test, though, it wasn’t a big driver of the differences.
Exchange, timezone, and bar boundaries were more like preconditions to line up before starting. If signals land in nearly the same places but entry prices and PF still differ, I suspect the calculation more than the data.
- Data: exchange, timezone, bar boundaries
- Signal alignment: the bar where the signal is confirmed vs the bar where the position applies
- Fill price: what price you assume the order filled at
- Costs: commission and slippage, down to the units
- Intrabar order: whether the stop-loss or the take-profit was hit first
- Lookahead: whether future values leaked in
Change one assumption at a time and compare.
Does TradingView fill at the close or the next bar’s open?
It fills at the next bar’s open by default. As of November 3, 2026, the Pine Script v6 docs say the broker emulator fills orders on historical bars after the bar closes, so a market order created on a bar’s close fills at the next bar’s open.
You can change that with process_orders_on_close = true in strategy(). Its default is false.
That was my first hypothesis: TradingView fills at the next open and my Python filled at the signal bar’s close, so the prices must differ.
On BTC 15-minute bars it barely mattered. Across 8,831 pairs of consecutive bars, the gap between a bar’s close and the next bar’s open averaged $0.01, with a maximum of $8.14.
This market trades 24 hours a day, so the previous close and the next open were nearly the same.
I ran Python both ways: fills at the signal bar’s close, and fills at the next bar’s open. Both gave 39 trades, +$398.52 net profit, and PF 1.339, identical to the second decimal place.
TradingView with its default fills gave the same 39 / +$398.52 / 1.339. In this experiment, the fill-timing hypothesis ended up as a control.
Markets with gaps are different. Where the close and the next open drift apart, as in stocks, fill timing can turn into a real price difference. That’s a general principle, not something I measured here.
Lookahead without any future rows: my missing shift(1)
Lookahead bias is when a backtest uses information that wasn’t available at the moment the trade decision was made. You can introduce it without ever referencing a future row.
Filling at the close isn’t the problem in itself. The problem is taking the return of the very bar that produced the signal.
That’s what my code did. It calculated the indicators and fed the signal straight into the same row’s return.
The code looked natural. Nothing like future appeared anywhere.
df["signal"] = (df["sma20"] > df["sma60"]).astype(int)  # confirmed at bar t's close
df["position"] = df["signal"].shift(1)                  # held from bar t+1
df["ret"] = df["position"] * df["close"].pct_change()
# the version I wrote: df["ret"] = df["signal"] * df["close"].pct_change()
shift(1) moves the position one bar later, so a signal confirmed at bar t’s close earns bar t+1’s return.
Adding it brought performance down. In the reproduction run (zero costs, bar-by-bar calculation, same signal, same data), the version without the shift made +$1,455.69. The version with it made +$1,193.96.
The missing shift inflated the result by about 22% (+$261.73). The effect is the same as knowing the signal one bar early.
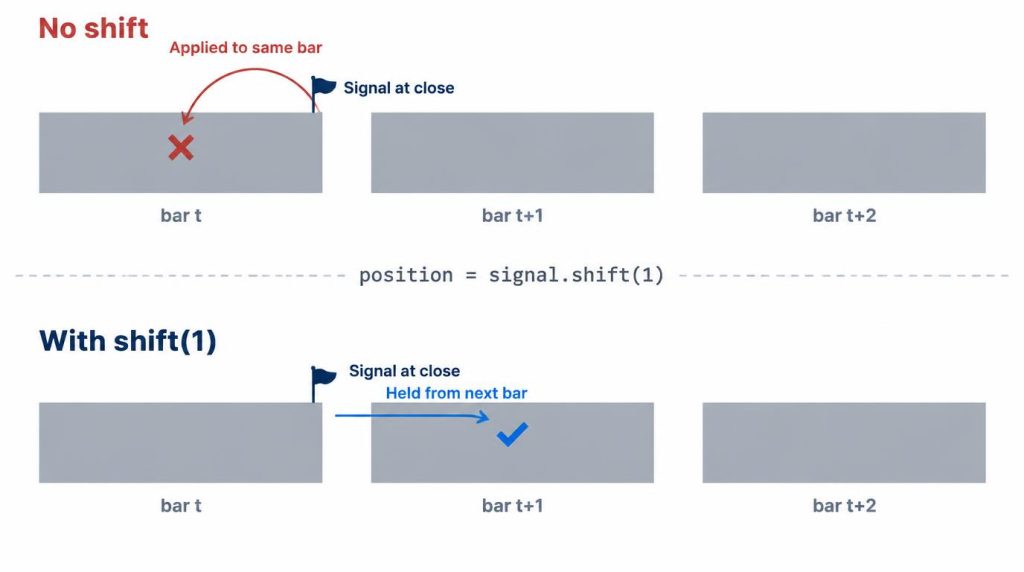
shift(1): which bar's return the signal is applied to.This calculation multiplies the position state by each bar’s return, a vectorized approach. Don’t compare it directly with the trade-level numbers in the rest of this post.
How do you match commission and slippage between TradingView and Python?
Match the units first. Entering the same number on both sides doesn’t give you the same cost model.
Pine’s strategy() declaration offers three commission_type values:
strategy.commission.percent: a percentage of each transaction’s value (the default type)strategy.commission.cash_per_order: a fixed amount per orderstrategy.commission.cash_per_contract: a fixed amount per contract, share, or unit
commission_value defaults to 0, so a strategy pays no commission unless you set one. slippage is a whole number of ticks added against you on market and stop orders, and it also defaults to 0.
My Python backtest subtracts a commission rate directly from returns. So 0.1 on both sides only means the same thing once both are a percentage per side.
With commission set to 0.1% per side, both environments gave the same values. The result that was +$398.52 (PF 1.339) with zero commission dropped to −$224.13 (PF 0.861) on both sides.
Of the 39 trades, 9 were profitable. The trade-by-trade comparison also matched on 9 trades.
I measured slippage in Python only. Adding $85 of adverse slippage per fill took the commission-only result from −$224.13 (PF 0.861) to −$887.13 (PF 0.590).
The $85 is an arbitrary value I picked, roughly 0.1% of the BTC price at the time. It isn’t an exchange slippage statistic; it shows how far slippage could move this period’s result.
Stop-loss and take-profit in the same bar: which fills first?
A 15-minute bar only gives you open, high, low, and close. With a 1% stop-loss and a 2% take-profit, a single bar can touch both, so the backtest has to assume which came first.
TradingView’s broker emulator assumes a path inside each bar. If the open is closer to the high, it assumes open → high → low → close. If the open is closer to the low, it assumes open → low → high → close.
The use_bar_magnifier = true setting lets the emulator use lower-timeframe data instead of that assumption, but the docs list it as a Premium and Ultimate plan feature.
I implemented the same open-high-low-close rule in Python and matched it against TradingView trade by trade, with zero slippage. With a filter for a bullish 1H bar added, both sides gave 23 trades, −$404.20, and PF 0.599.
I compared 14 trades one by one, and all of them matched.
Without the 1H filter, Python alone with 0.1% commission plus the stop-loss and take-profit gave 39 trades, −$483.08, and PF 0.681. That’s lower than the PF 0.861 with commission only.
Can request.security() leak future data into a backtest?
On historical bars, it can. TradingView’s repainting page warns that lookahead = barmerge.lookahead_on without an offset returns data from the future on historical bars.
Its non-repainting pattern pairs the [1] offset with lookahead_on, so the call reads the last completed higher-timeframe bar.
Lookahead moved the results even more. I compared two 1H filters on the same strategy with the same commission.
One checks whether the last completed 1H bar was bullish. The other looks at the final direction of the 1H bar that is still forming, which matches calling request.security() with lookahead_on and no offset.
- Correct filter: 23 trades, −$404.20, PF 0.599
- Leaky filter: 27 trades, −$38.77, PF 0.958
The leaky version looks close to break-even, and the trade count changes too. I confirmed both results directly in TradingView.
During the experiment I also put in a wrong setting on purpose, and watched the equity curve get too good.
Is repainting the same problem as lookahead?
It’s a different problem. Repainting is when a script shows different results on realtime bars than it does later on the same bars as history.
A strategy that decides on unconfirmed realtime values can look different once the bar closes and the chart recalculates. The calc_on_every_tick setting (recalculate on every realtime tick) defaults to false, and the strategies docs note that changing a strategy’s script execution settings can cause repainting.
So for a live-trading candidate, I also check that the signals reproduce on bar-close values.
My step-by-step match: four stages, same numbers
At all four zero-slippage stages, TradingView and Python matched on trade count, net profit, and PF.
| Condition | TradingView | Python |
|---|---|---|
| Commission 0 | 39 / +398.52 / 1.339 | 39 / +398.52 / 1.339 |
| + 0.1% commission | 39 / −224.13 / 0.861 | 39 / −224.13 / 0.861 |
| + SL/TP, 1H filter | 23 / −404.20 / 0.599 | 23 / −404.20 / 0.599 |
| + SL/TP, leaky filter | 27 / −38.77 / 0.958 | 27 / −38.77 / 0.958 |
Each cell is trades / net profit ($) / PF, with zero slippage. SL/TP is the 1% stop-loss and 2% take-profit, on top of the 0.1% commission.
A match means this Python implementation calculates by the same rules as TradingView. If even one assumption differs, the results split, and lining them up one at a time from the top shows where.
The setup: BTCUSDT 15-minute bars from Binance’s public data repository, trading window August 20 to October 1, 2026 (UTC), about six weeks. The strategy was an SMA20/60 crossover, long only, with a fixed size of 0.1 BTC.
The limits are clear. It’s about six weeks, one strategy, one window, and 39 trades.
The numbers compare how much each assumption moves the result. They aren’t a measure of this strategy’s profitability, and they aren’t a general conclusion.
Is a TradingView backtest accurate enough to rely on?
For a quick check, I find it useful. I don’t use it as my only final evidence.
My order: check an idea quickly in TradingView, reimplement the same logic in my own code, and switch the cost and fill assumptions to conservative ones. Then I split the period to look at out-of-sample (OOS) results and check other market regimes.
Sources
Official pages checked on November 3, 2026.
- Pine Script Strategies: next-bar-open fills,
process_orders_on_close, intrabar price path, Bar Magnifier,calc_on_every_tick - Pine Script declaration statements (
strategy()):commission_typevalues and defaults, slippage in ticks - Pine Script Repainting:
lookahead_onwithout an offset on historical bars, the[1]offset pattern
I first wrote this in Korean on my blog: https://jjeongil.tistory.com/3593.