If you get a 504 Gateway Timeout and your app logs show no errors, the app probably didn’t send that response. A 504 comes from a gateway or proxy that stopped waiting. In my case, the failed requests stopped near 30 seconds: the gateway/load balancer (LB) timeout ran out while the app was still waiting on a downstream call.
A 504 Gateway Timeout is a status code a gateway or proxy returns when it didn’t get a response from the server behind it in time. That’s the RFC 9110 definition. The key word is gateway: the code tells you a front layer gave up, not that your code crashed.
This post covers the order I check things in, the 504 I first misread as an app problem, and how I tell it apart from a 502 and a 503. My setup is a Spring Boot service behind nginx, an API gateway, or a load balancer. Public defaults below are as of November 4, 2026.
If you only saw a 503 or 504 while visiting someone else’s site, the problem is on their server. Refresh, and if that fails, come back later. The rest of this post is for people running the service.
On this page
Why does a 504 leave nothing in the app logs?
The layer that gave up usually isn’t the app. When the front layer’s wait limit expires, it sends the 504 to the client and closes its side. The app may still be working on the request, or waiting on something else. Nothing failed inside the app yet, so there’s nothing for it to log as an error. The client sees a failure while the work goes on, the same gap that lets a failed API call still leave changes behind.
That’s exactly what happened to me. The path was LB/gateway → Spring Boot A → downstream B, and the API call ended in a 504.
I assumed Spring Boot’s own processing or a DB query was slow. So I opened the application logs and the DB first. No clear errors.
Next I lined up the durations of the failed requests side by side. They weren’t spread out the way random slow requests are. They stopped near 30 seconds. When the app itself is slow, durations are usually all over the place.
With that number in hand, I checked the timeout settings in the gateway/LB admin console. The front-layer timeout was running out first.
Then I matched the same requests in the app logs. After that point, A was still waiting on B, and B could take longer than 30 seconds. The app never finished its response, so it made sense that no error showed up.
Since then, when failures repeat at a fixed duration, I first check whether it’s an infrastructure timeout boundary like 30 or 60 seconds. Only after that do I hunt for slow code.
Those round numbers line up with common defaults. As of November 4, 2026, nginx’s proxy_read_timeout defaults to 60s (nginx docs). An AWS Application Load Balancer’s idle timeout defaults to 60 seconds (AWS docs). Amazon API Gateway REST APIs have an integration timeout of up to 29 seconds by default; Regional and private APIs can request more (AWS quotas).
How I find the layer that produced the response
Before looking up what the status code means, I narrow down who produced it: the client, the front layer (CDN, LB, API gateway, nginx), the application, or a downstream service.
I check in this order:
- Response headers
- LB access log
- Gateway log
- Application access log
To match one request across all four, I use a request ID like X-Request-ID. The front layer creates it and passes it on, and Spring Boot logs the same ID. Then gateway, app, and downstream call logs read as one thread.
That changes the question. Instead of “a 504 happened,” I can see whether the request reached the app and where it last waited.
If the LB logged the request but the application access log has no matching entry, the front layer produced the response. App code moves down my list.
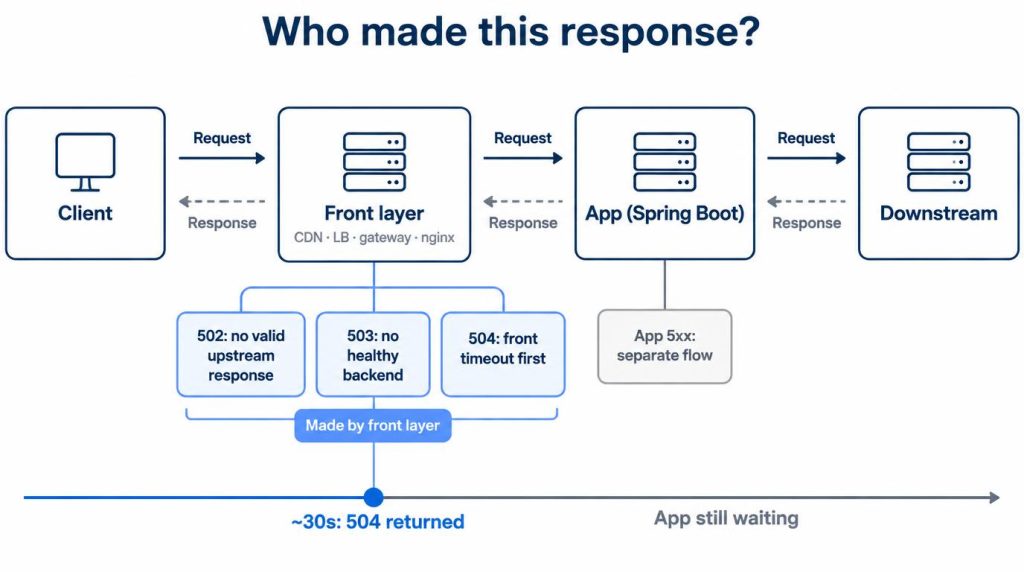
502 vs 503 vs 504: what tells them apart?
For a 502, I ask whether the front layer got a valid response from upstream. For a 503, whether any healthy backend is left to take the request. For a 504, which layer’s wait limit ran out first.
| Code | My question | Where I look first | Common trap |
|---|---|---|---|
| 502 Bad Gateway | Valid HTTP response from upstream? | Gateway/nginx error log, app access log | Looks like the app returned it |
| 503 Service Unavailable | Any healthy backend left? | LB backend health, deploy status | Server may be up but refusing (maintenance) or overloaded |
| 504 Gateway Timeout | Whose timeout ran out first? | LB/gateway timeouts, request durations | Looks like a slow app when the front layer cut it off |
Here’s what each one looked like for me.
The 502. A Spring Boot service relaying calls to an external API. 5xx errors went up in monitoring. At first I thought the app had returned the 502 itself.
When I traced the same request, the front layer’s access/error log had the 502. The application access log had no normal response for it. The front layer never got a valid HTTP response from upstream, so the 502 came from the front proxy, not the app. Only then did I look at the upstream connection state.
The 503. This came right after a deploy. The new Spring Boot instance had its process up and its port open, so I assumed it was ready.
But handling requests needed the DB connection and initial config loading to finish first. The health check didn’t pass before then. While the LB had too few backends it considered healthy, some requests got a 503. Process up and port open weren’t what the LB was checking.
Since then I treat “Has the process died?” and “Is it OK to send traffic now?” as two separate questions. That’s why I look at liveness and readiness separately. Spring Boot Actuator exposes them as /actuator/health/liveness and /actuator/health/readiness, and the Spring Boot docs say these health groups are enabled automatically.
Does raising the timeout fix a 504?
If the cause is a slow call, a longer timeout only delays the 504, and the slow request holds threads and connections for longer.
I tried it once, in that same 504 incident. I read it as a front-layer timeout that was too short and raised the value.
The 504 just showed up later. B’s processing time didn’t change. The slow requests stayed alive in the app longer and kept threads and connections busy. With overlapping requests, even normal ones could end up waiting longer.
So a drop in the 504 count doesn’t mean it’s fixed. I also check whether B’s latency and the resources stuck waiting went down.
Before touching the timeout value, I ask four questions:
- Why is it slow?
- Does the user’s response actually need this call?
- Can it fail fast?
- Can it move off the synchronous call path?
For the fourth, I got as far as evaluating the split.
Should I retry after a 503 or 504?
For a 503, look for a Retry-After header. If it’s there, retrying after that time is the safe choice. A 503 comes from a temporary state like maintenance or overload, and the server can use Retry-After to say when to come back. RFC 9110 makes the header optional, though, so many responses don’t include it.
A 504 needs more care. The front layer gave up, but the request may still be running behind it, as mine was. Retrying blindly can run the same work twice. The automation version of this is n8n’s Retry On Fail sending a request twice.
What if the app threw the 5xx itself?
If the request reached the app and the app built the error response, I don’t judge it from the gateway status code alone. A 500 the app threw goes into a separate flow.
The order above only gets you to the layer that produced the response. How I trace errors inside the app is in my 500 error hub post (in Korean).
References
- RFC 9110 §15.6, Server Error 5xx: standard definitions of 502, 503, and 504
- MDN: 502 Bad Gateway: how 502 differs from 504
- MDN: 503 Service Unavailable: maintenance, overload, and Retry-After
- nginx ngx_http_proxy_module:
proxy_read_timeoutdefault (checked 2026-11-04) - AWS: Application Load Balancer attributes: idle timeout default (checked 2026-11-04)
Show 2 more sources
- AWS: API Gateway REST API quotas: integration timeout (checked 2026-11-04)
- Spring Boot: Actuator endpoints: liveness and readiness health groups (checked 2026-11-04)
I first wrote this in Korean on my blog: https://jjeongil.tistory.com/2095.